
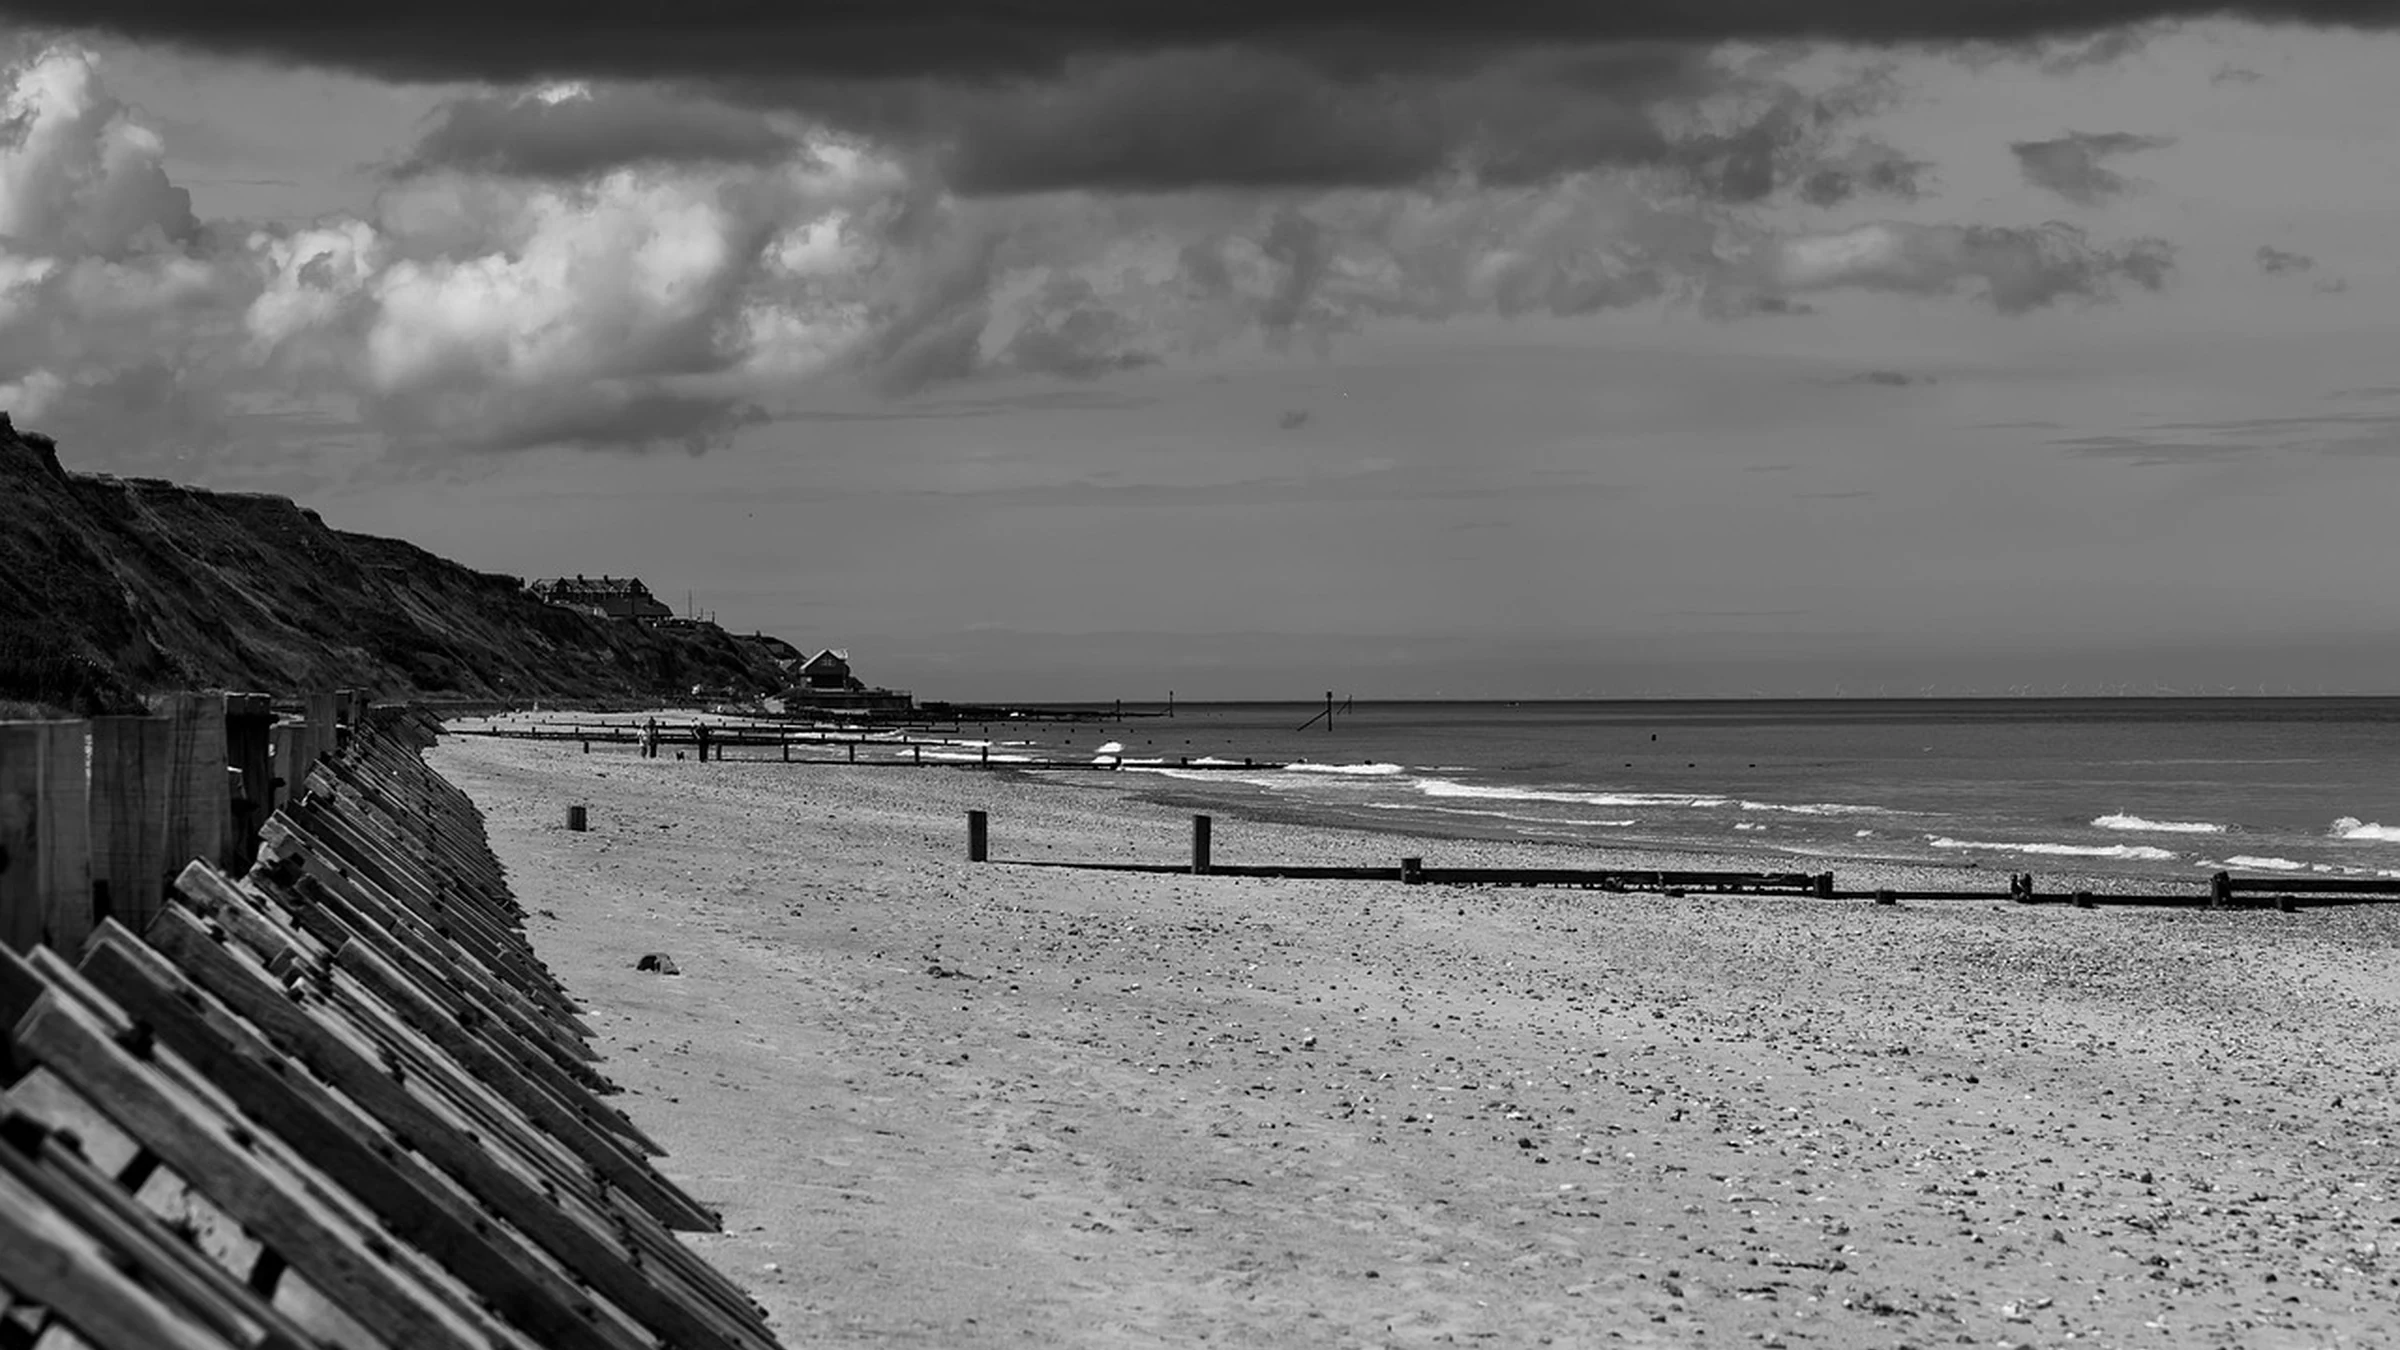
England’s new flood investment scenarios show how the best-value mix of defenses changes as spending rises. A larger portfolio gives surface-water measures more weight, while coastal damage remains a long-term challenge even under sustained investment.
The Environment Agency’s 2026 flood investment assessment asks which blend of measures would avoid the most economic damage at different spending levels. That is a different decision from choosing one town’s defense scheme. National portfolios allow the agency to compare maintenance and new construction with smaller interventions spread across a catchment or a neighborhood. The result changes when the budget is large enough to move beyond the strongest projects.
Why the First Investments Favor Defenses
The November assessment compares risks from rivers, the coast and surface water across England. It examines the costs of protecting places and the economic damages avoided over 50 and 100 years. The model can select from options including maintenance, higher or new defenses, natural flood management, sustainable drainage and property measures. It tests each long-term spending scenario against a design climate and a more extreme one.
At the lowest of its three optimized spending levels, the design-climate scenario puts 57 percent of investment toward coastal risk and 34 percent toward river flooding. Surface water receives 9 percent. Early spending goes to options that prevent substantial damage for the money involved. For example, restoring the effectiveness of an existing defense can reduce exposure across many properties together. The remaining projects may cost more per pound of damage avoided or protect smaller groups of properties.
What Changes as the Portfolio Grows
In the middle scenario, surface water rises to 46 percent of modeled investment under the design climate. Coastal and river interventions remain significant, though a larger share of the added money goes into measures such as sustainable drainage, storing runoff in the catchment and protecting individual properties. The change follows from the ranking of additional opportunities once many of the higher-return coastal and river options are already included.
Surface-water flooding can occur away from rivers, when rain collects or flows across land faster than local drainage can carry it away. The places affected can be dispersed. This makes the major-defense model hard to repeat everywhere. A neighborhood may need space for runoff, improvements to drainage routes and changes at buildings where water can still get in. The national model estimates where portfolios of such measures add value. Developing a local scheme still requires land, engineering and coordination with the people who own or manage the assets.
Reading the Damage Figures
The middle scenario averages £2.5 billion a year under the design climate and keeps total modeled annual damages around today’s level over 25 years. By 2075, total annual damage is about 10 percent above today’s level, with losses from surface water alone about 40 percent higher. The total can stay close to its starting point while one source of flooding gets worse and damage avoided elsewhere offsets part of the increase.
The result also depends on the climate used for planning. More severe sea-level rise drives higher long-term coastal losses and changes the mix of investments worth making. Some places will need time to consider changes to buildings, land use or relocation alongside improvements to defenses. Waiting for damage to accelerate can narrow those choices.
How the Scenarios Can Inform Real Projects
The assessment does not assign budgets to named schemes. England’s funding guidance sets separate rules for refurbishing existing works and taking new projects through appraisal. For a local authority, the starting point is the type of flooding causing the losses and the opportunities available before a preferred measure is chosen. The national shift toward surface-water investment at higher spending levels suggests that places able to put together land, drainage and property proposals will have better options to bring forward.
Take-Out
The modeled spending mix shifts as the highest-return options are used up. Local planners can use that finding to identify where drainage and property resilience need a stronger pipeline of projects.
Questions and answers
What readers should know
- Which flooding sources are modeled?
- The Environment Agency considers river flooding, coastal flooding and surface water.
- What happens to surface-water investment as the portfolio grows?
- Under the design climate, its share of modeled investment rises from 9 percent in the lowest optimized scenario to 46 percent in the middle scenario.
- How much does the middle scenario assume?
- It averages £2.5 billion a year under the design climate. The more extreme climate scenario requires a different portfolio and spending profile.
- Does the middle scenario keep losses stable?
- Total annual damages remain around today’s levels over 25 years under the design climate. The model shows an increase by 2075, with different trajectories for each source of flooding.
- Does the assessment approve individual projects?
- Projects still need local design and appraisal through the applicable funding process. The assessment compares national portfolios.
Stay in the loop
Keep Mark and Focus in view
Hear about future publications, announcements, and relevant updates from Mark and Focus.